Visualisasi eHouse Creatatau - drawing views based on individual design atau template.
Pembuat / Editor Visualisasi eHouse (Grafik Vektor yang Dapat Diskalakan)
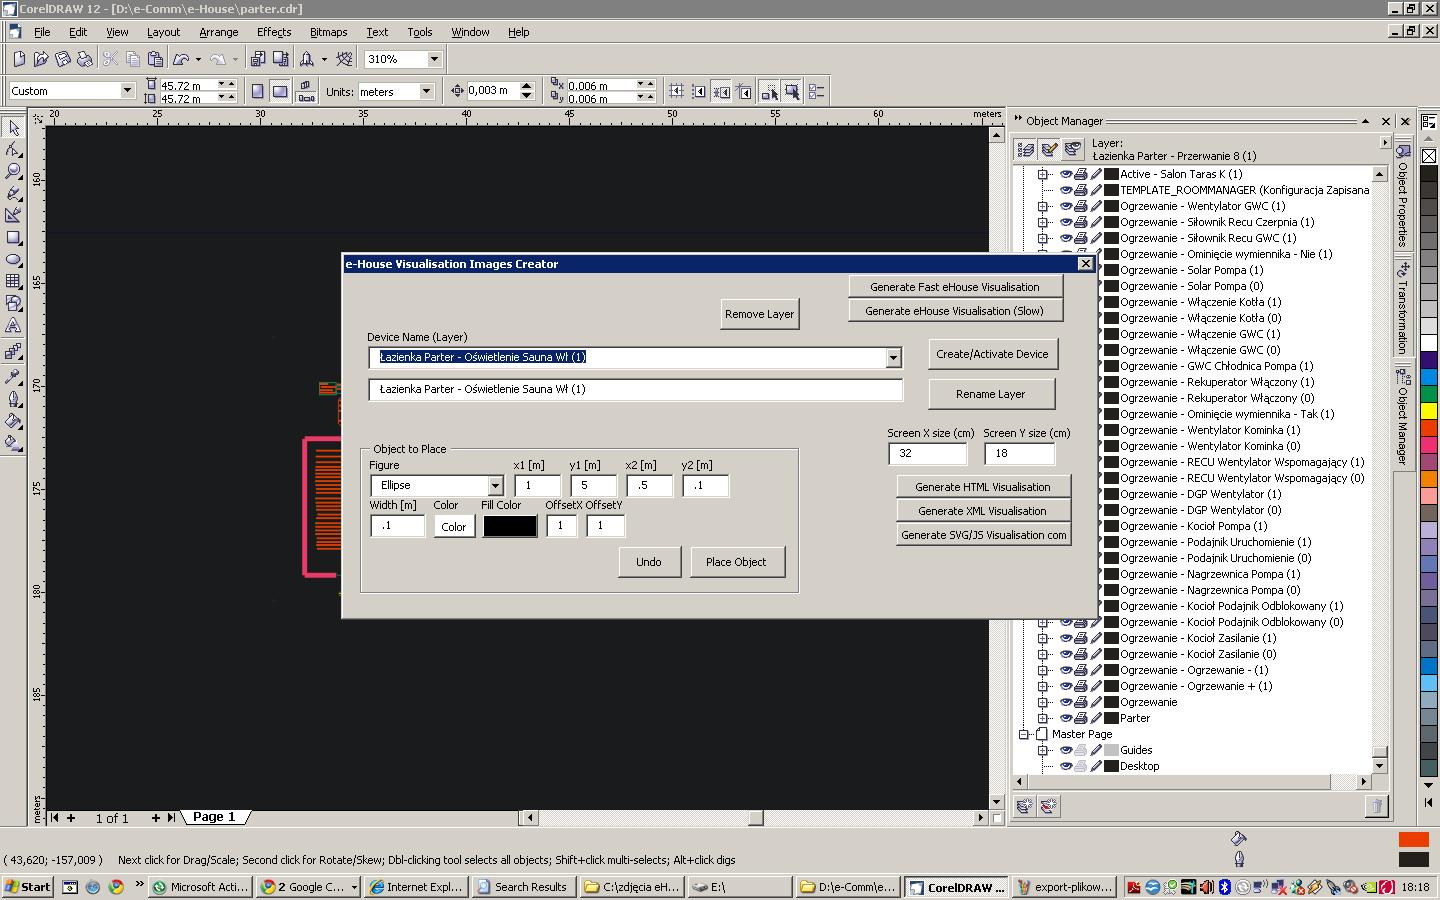
eHouse Visualization Creator / Editor adalah VBA (Visual Basic for Applications) untuk Corel Draw yang memungkinkan:- mengimpor nama dari Aplikasi konfigurasi eHouse
- Menggambar objek SVG: manual, didukung skrip, berdasarkan template individual
- Creating "Active Views" for graphic control for web browsers, and eHouse Visualization applications for Android, Java, Windows,.Net/.Net CF, etc
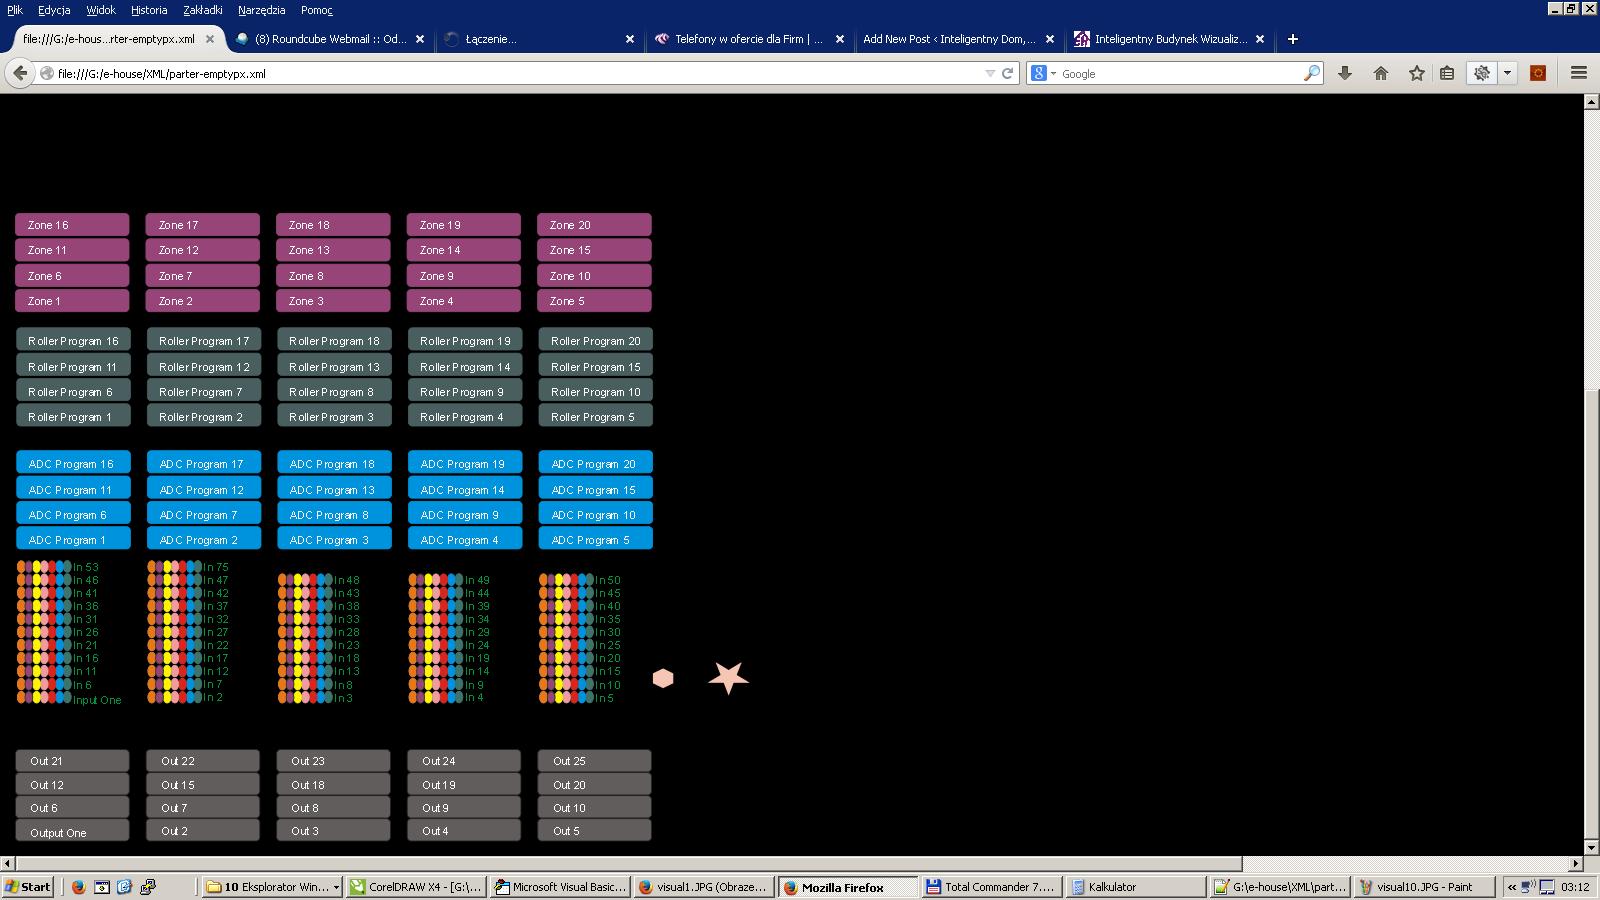
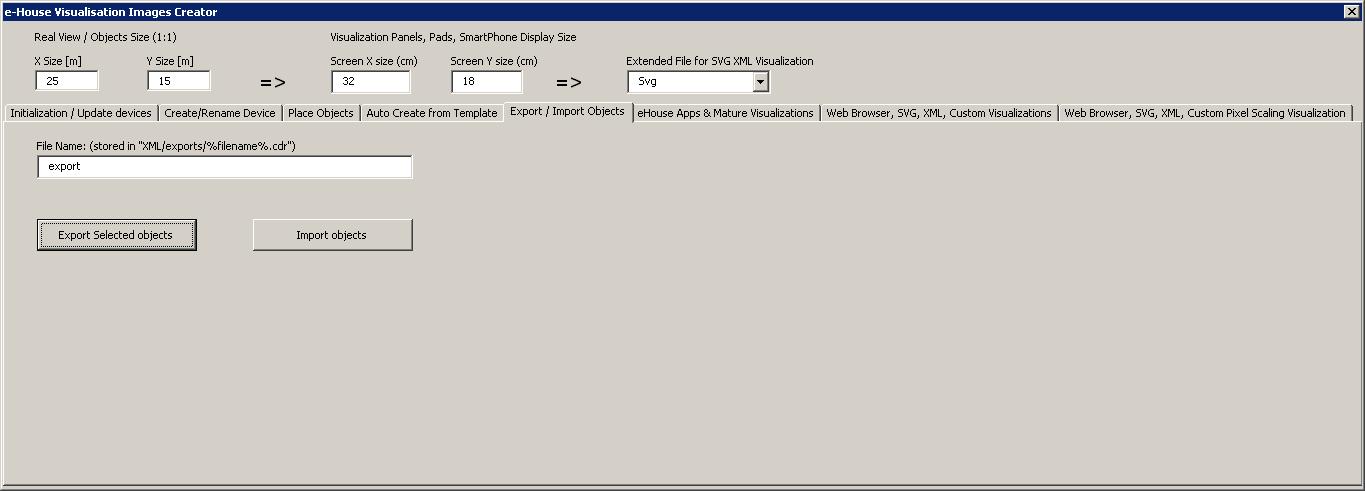
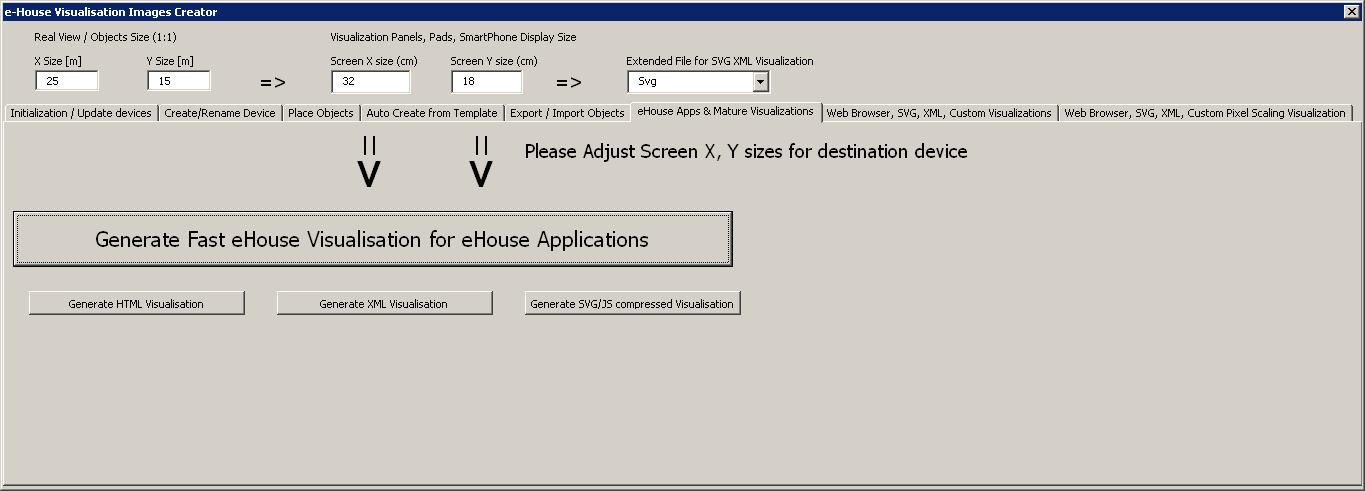
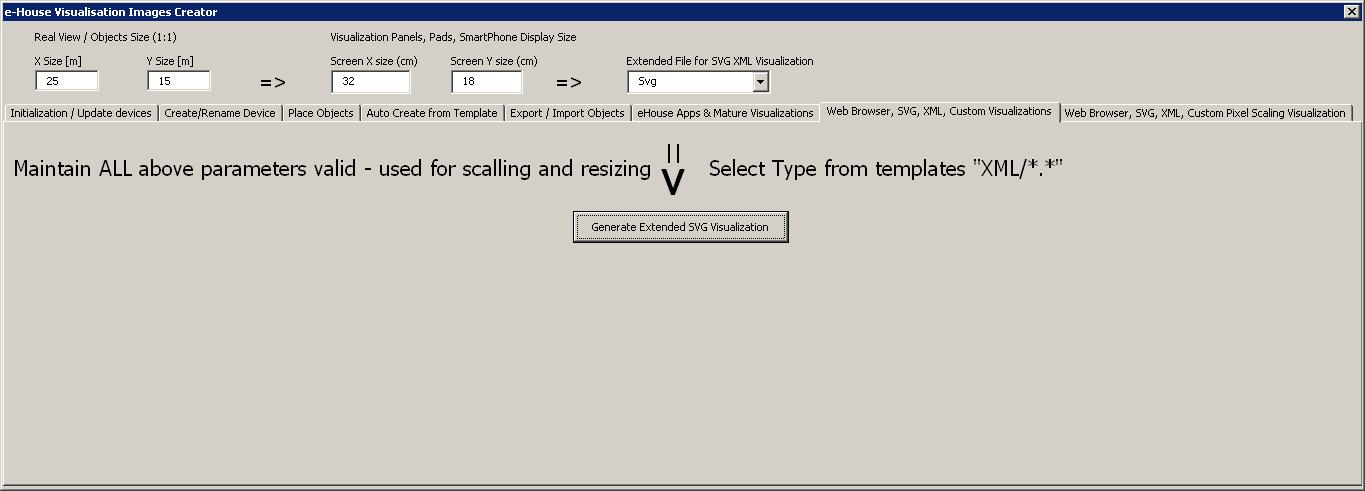
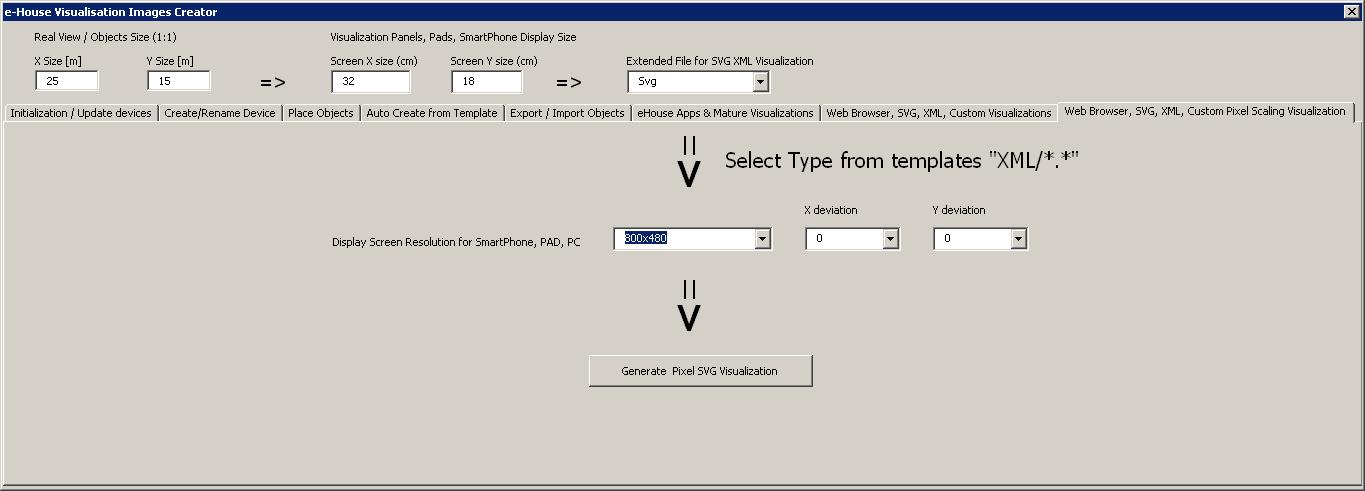
- Mengekspor Visualisasi untuk: Aplikasi eHouse asli, halaman Browser Web, Visualisasi Khusus (berdasarkan template) - dalam format teks
- Ekspor memungkinkan penyesuaian ukuran / resolusi layar dengan mudah
Solusi ini membutuhkan Corel Draw Aplikasi dengan dukungan VBA (tidak tersedia pada beberapa versi terbatas: Rumah / Siswa). However, creating of visualization is rather one-time operation, and you can use Evaluation/Trial Full version of Corel Draw to create visualization.
An example of eHouse Visualization view created for an individual project in the Corel Draw application using SVG (scalable vector graphics).
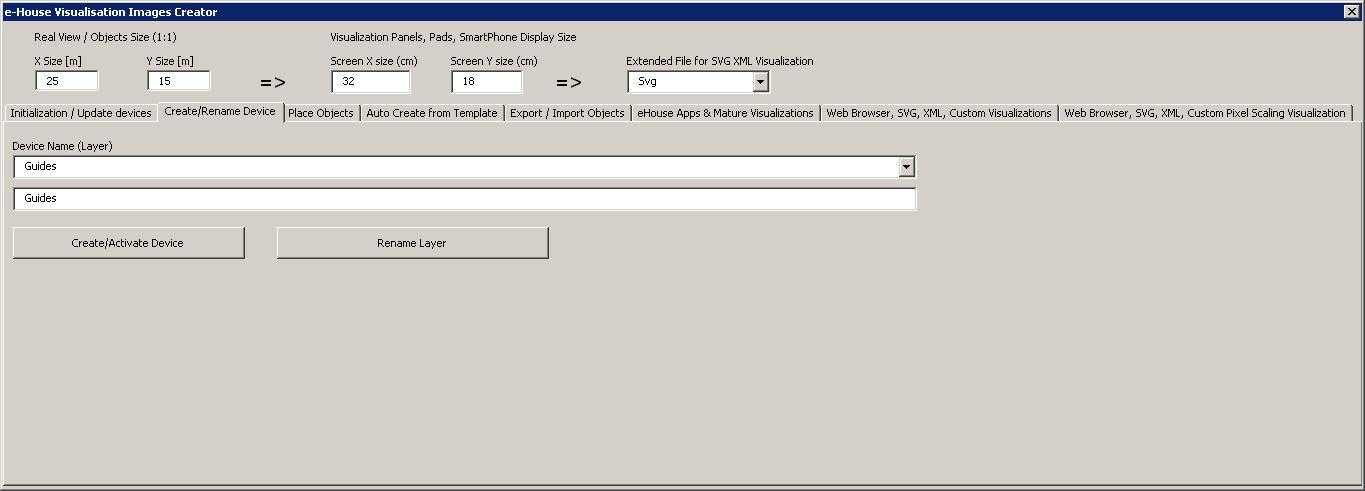
Each eHouse "Active object" (untuk setiap status tipe sinyal: on / off, high / low / ok) dibuat pada satu "Active" layer of the Corel Draw application
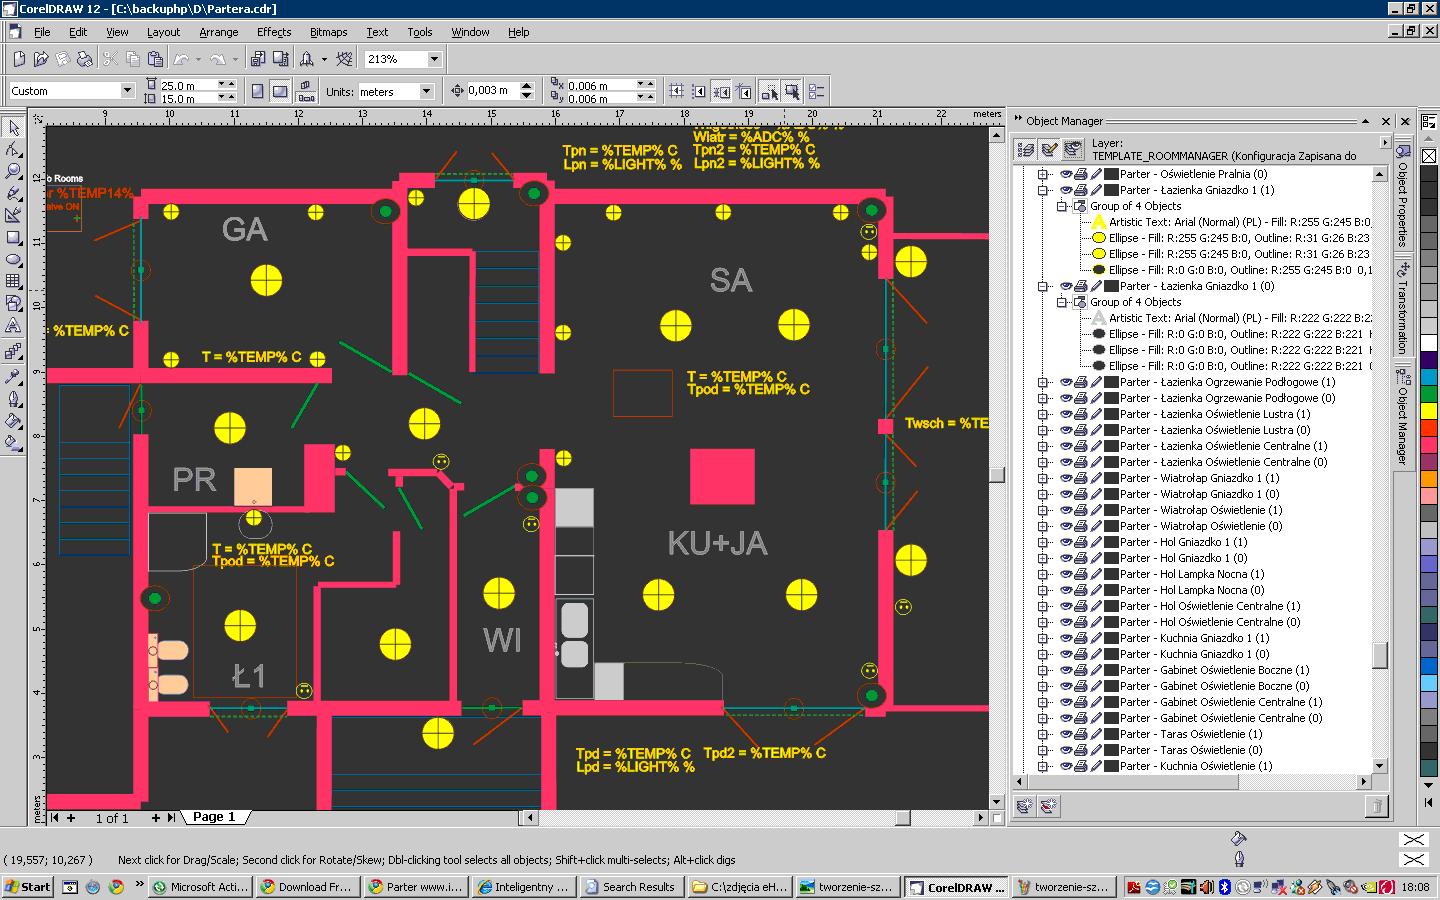
The view is created in 1:1 scale (entered X/Y initial size is in meters.
After initialization of empty "Active Form", walls/lines and other simple objects may be imported to the form in 1:1 scale to neutral layer.
Untuk sebagian besar fleksibilitas tampilan kontrol grafis & visualisasi (layar SmartPhone kecil, visibilitas di luar yang buruk, panel sentuh kecil), kami sangat menyarankan untuk meminimalkan objek yang tidak perlu pada tampilan untuk mencapai fungsionalitas penuh pada SmartPhones 5 inci (tanpa layar zoom dan scrolling).
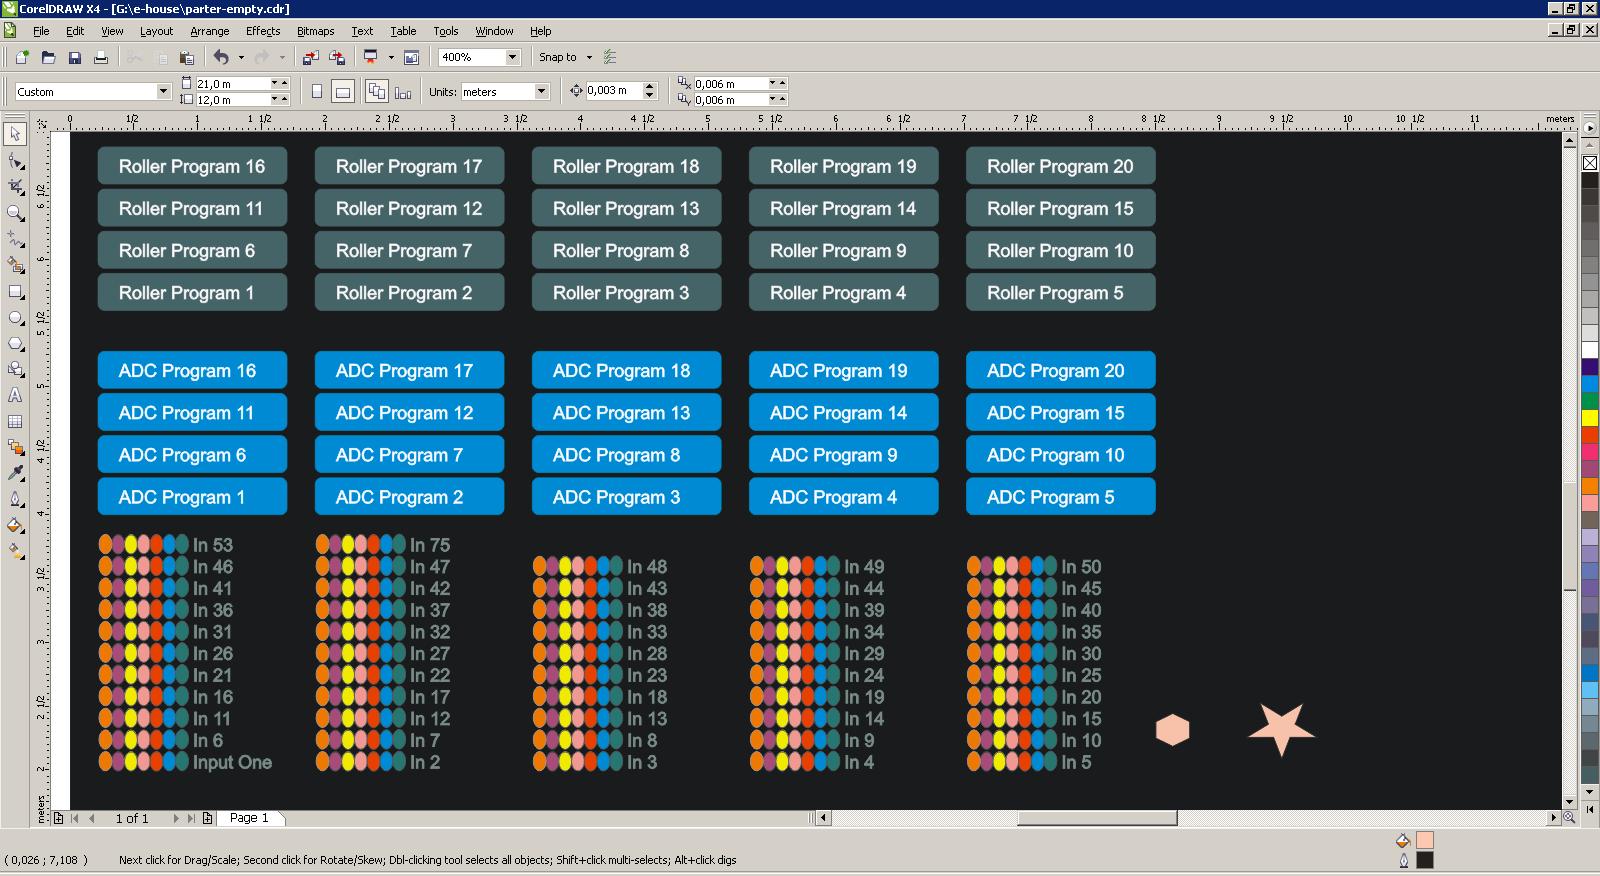
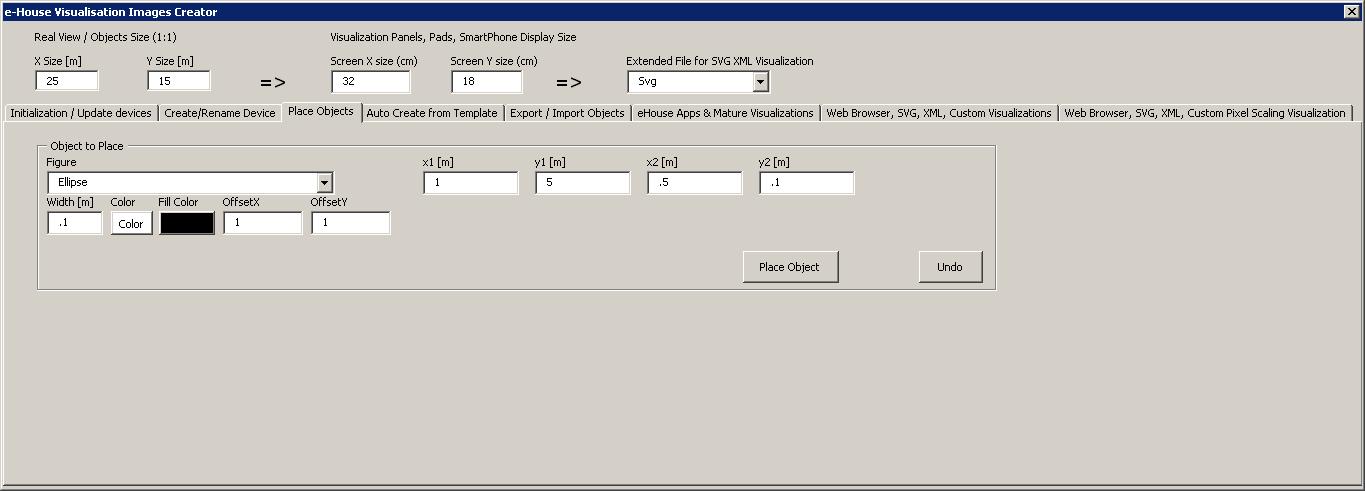
Visualization allows you to create simple "Active" gambar dan objek yang memastikan kompatibilitas tampilan yang tinggi untuk berbagai standar visualisasi eHouse:
- persegi panjang / persegi dengan kemungkinan pembulatan
- garis
- elips
- teks
- jalan
- lingkaran
- poligon
When precision positioning is required, macro supports placing direct objects at the required coordinates.
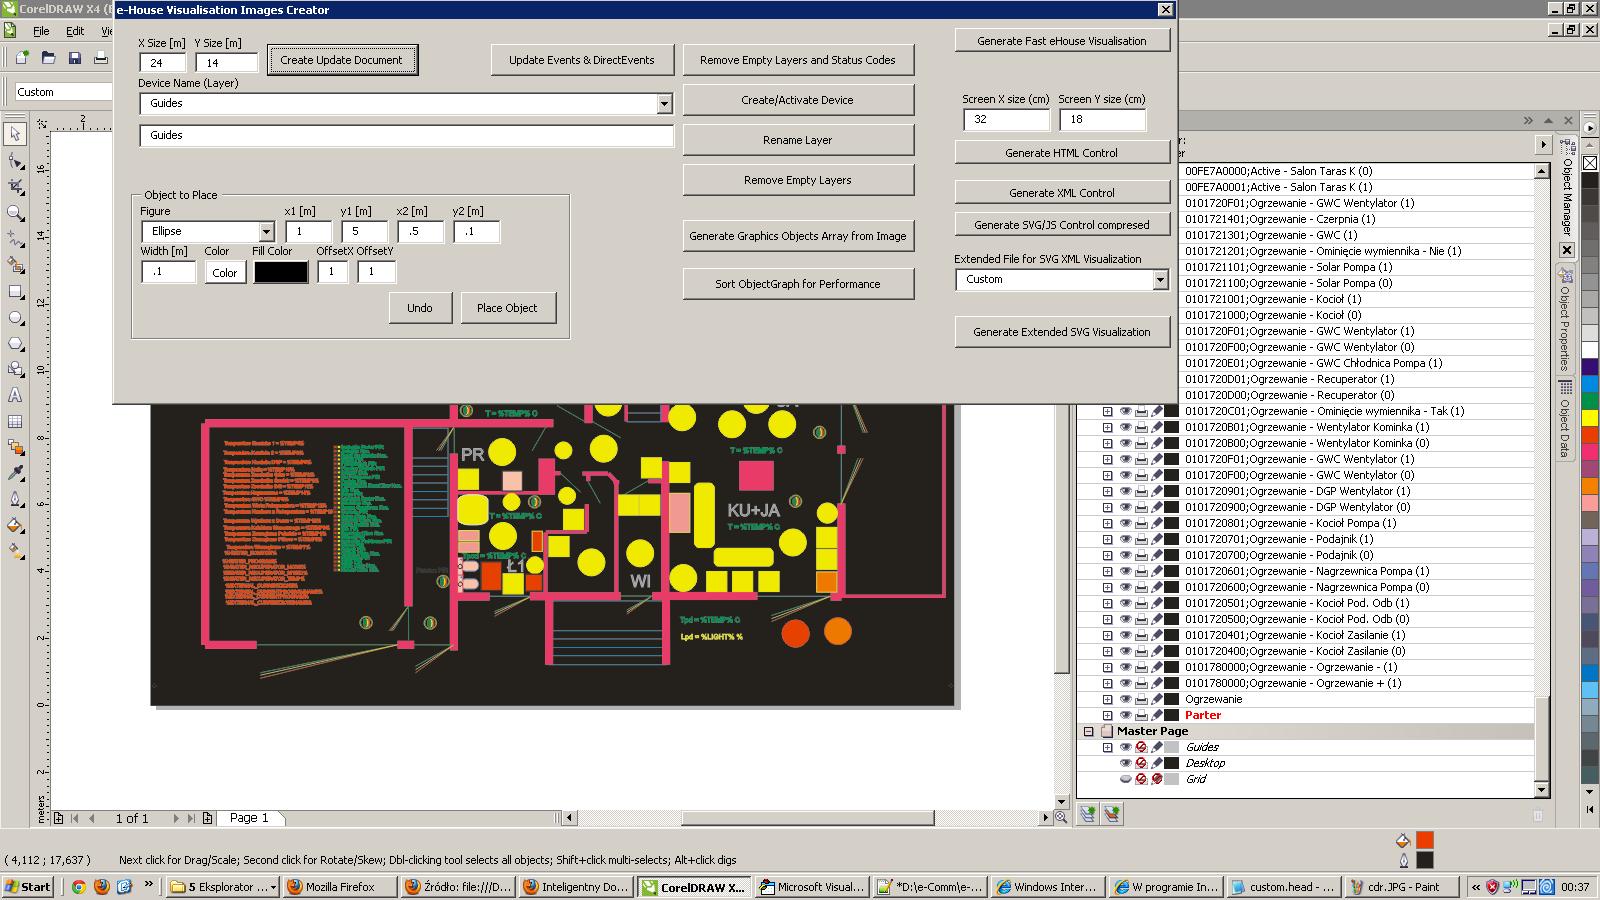
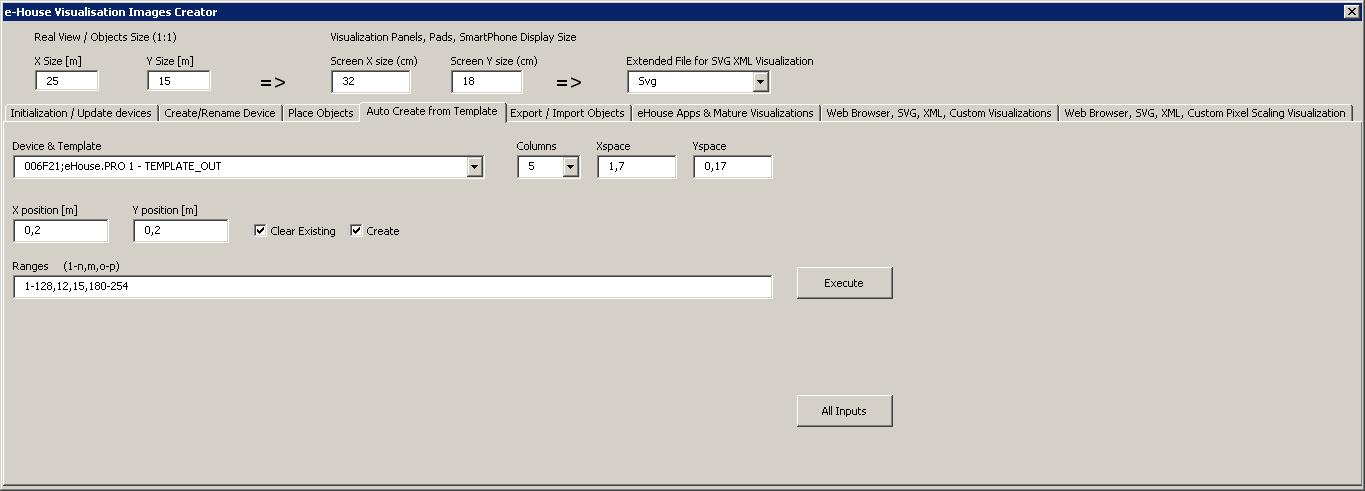
Membuat visualisasi otomatis berdasarkan template
Automatic placement of "Active objects" pada kanvas visualisasi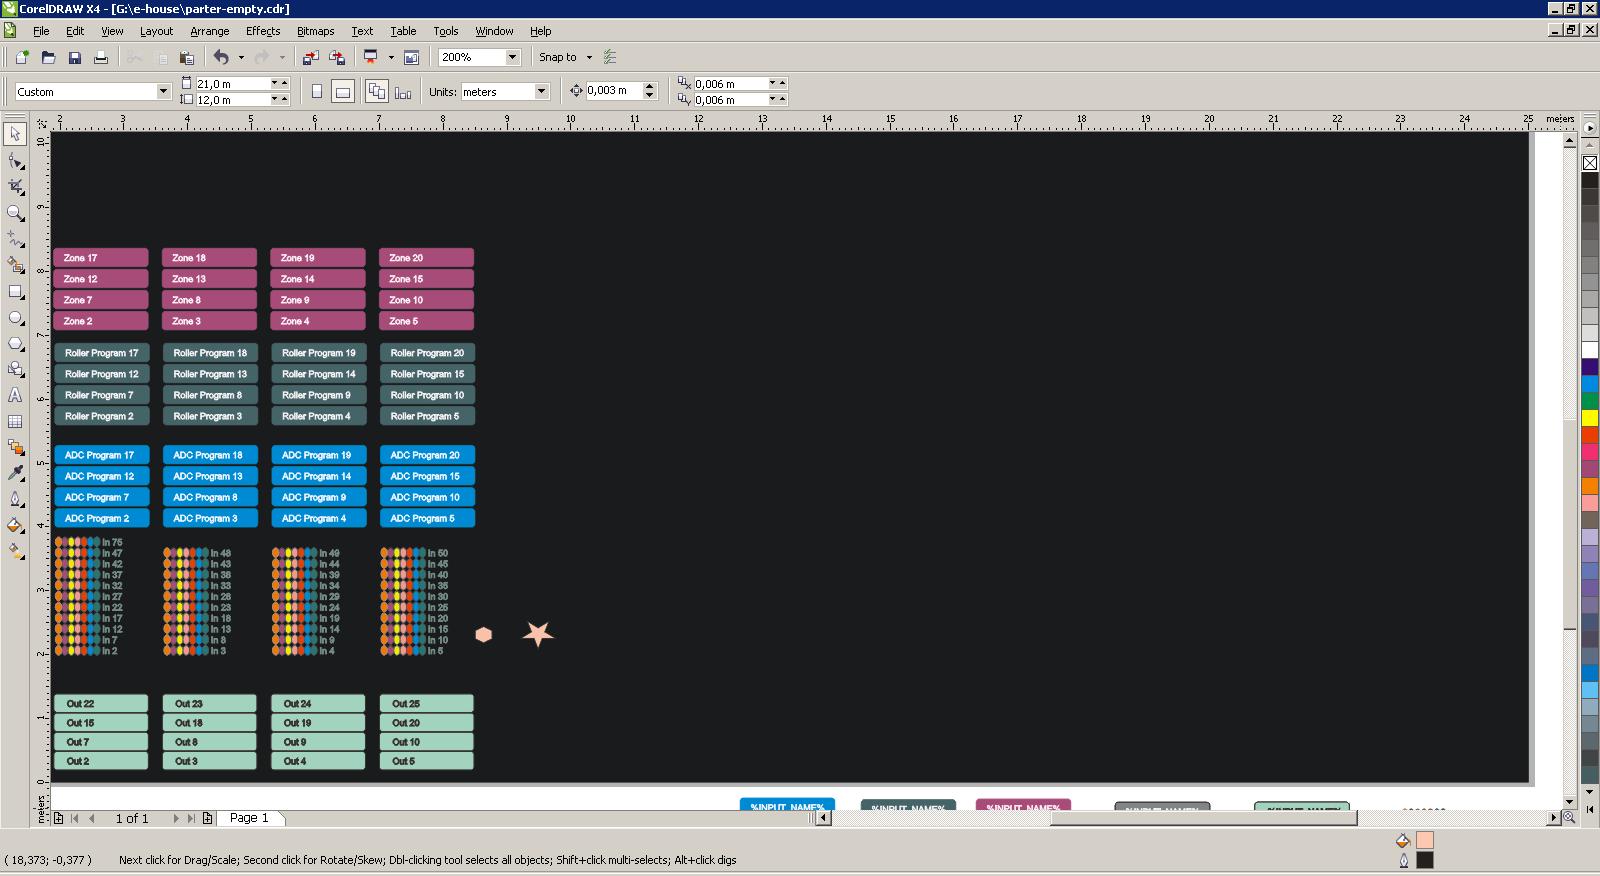
Lihat di browser web (SVG pendukung apa pun)
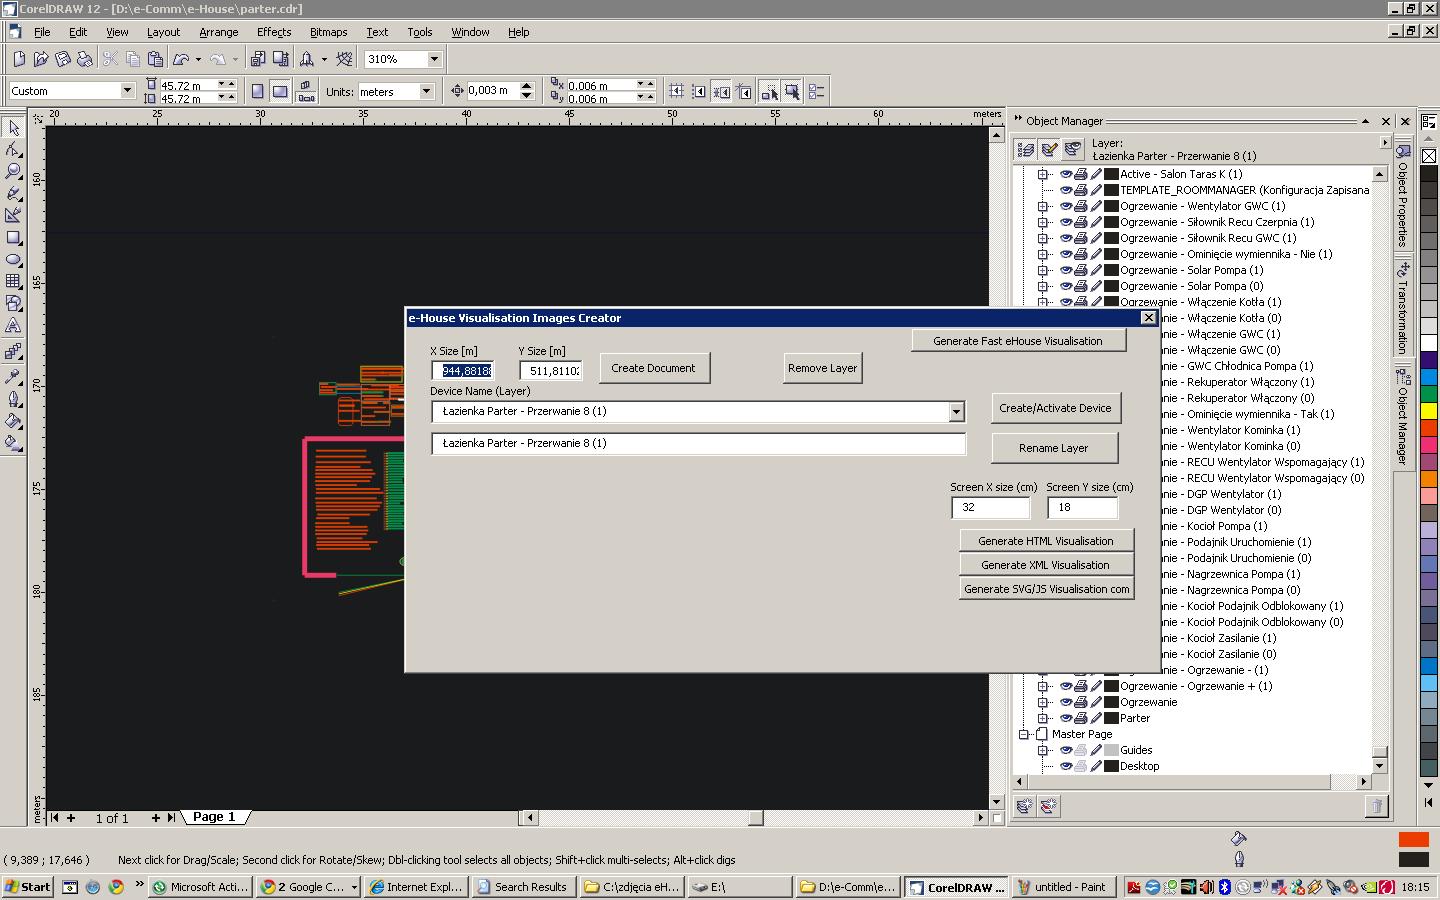
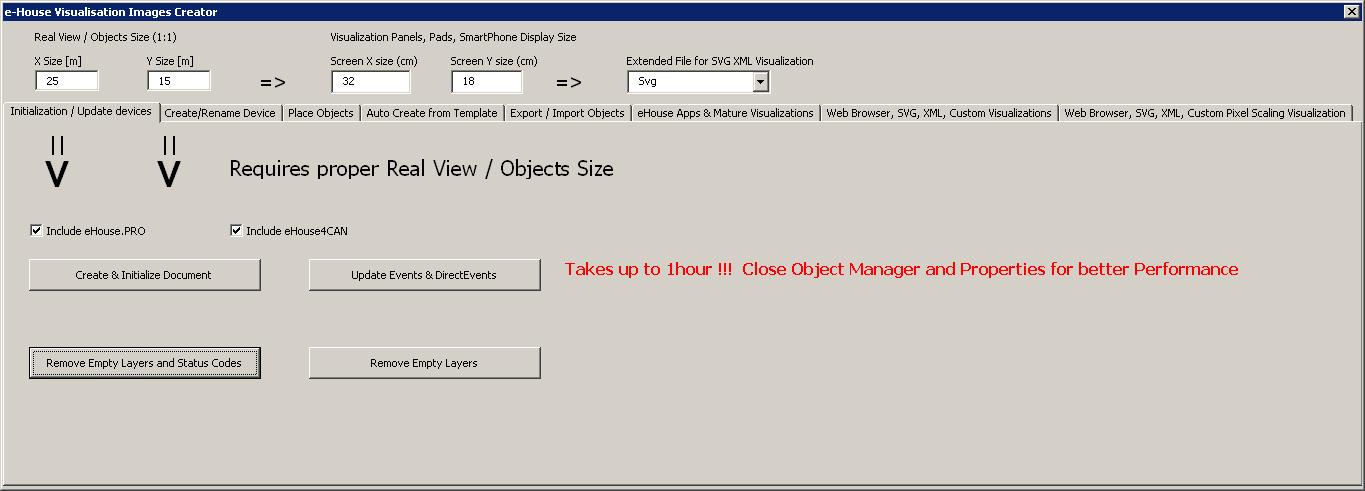
Initialization of visualization and loading of data from the eHouse configuration.
Ekspor data visualisasi untuk browser web, aplikasi Visualisasi eHouse
Deskripsi lengkap tentang membuat visualisasi dapat ditemukan di:
eHouse Building Automation Visualization Creator | PL